
Reviewed by Josh N · Updated August 17, 2026 · How we verify
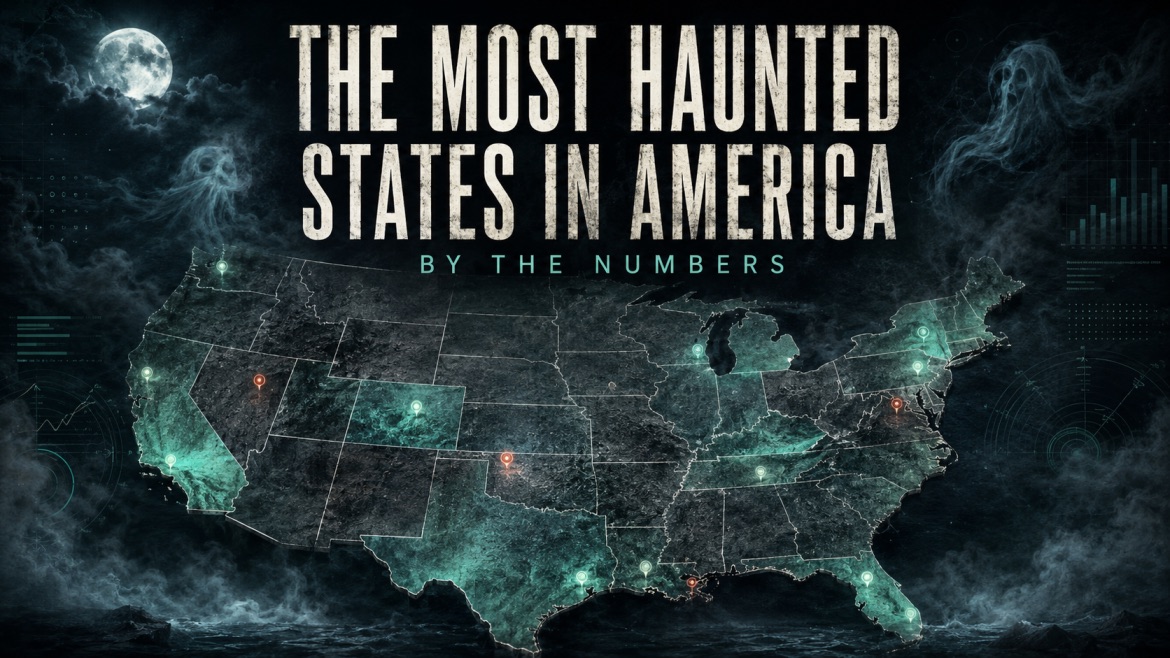
We have mapped and written up 705 haunted locations across all fifty states. Every one has coordinates, a documented history and a source list. That makes it possible to ask a question the internet argues about constantly and almost never answers with numbers: which state is actually the most haunted?
The honest answer is that it depends entirely on how you count, and the three sensible ways of counting produce three different winners.
The most haunted state per person
Divide the number of haunted places by the number of living people and the map turns inside out. The empty states win, and they win comfortably.
| State | Places | Per million residents |
|---|---|---|
| Alaska | 13 | 18.6 |
| Wyoming | 11 | 18.3 |
| Vermont | 10 | 16.7 |
| Maine | 18 | 12.9 |
| North Dakota | 10 | 12.5 |
| South Dakota | 11 | 12.2 |
| Delaware | 10 | 10.0 |
| Rhode Island | 11 | 10.0 |
| Montana | 10 | 9.1 |
| Connecticut | 27 | 7.5 |
Alaska tops the list with 18.6 haunted places per million residents. New York sits at the bottom with 0.6. The detail that makes the gap worth staring at: both states have exactly thirteen documented haunted locations in our records. Alaska simply has 700,000 people to New York’s twenty million.
| State | Places | Per million residents |
|---|---|---|
| Texas | 26 | 0.9 |
| Pennsylvania | 11 | 0.8 |
| California | 32 | 0.8 |
| Illinois | 10 | 0.8 |
| New York | 13 | 0.6 |
There is a plainer reading of this than “the frontier is thick with ghosts”. Sparse populations tend to leave buildings standing empty rather than demolished, and a single abandoned sanatorium in a town of four thousand becomes local legend in a way it never would in Brooklyn. Ghost stories need somewhere quiet to survive.
The most haunted state per square mile
Measure by land area instead and the ranking flips again. Now the small, old, densely built northeastern states dominate.
| State | Places | Per 1,000 square miles |
|---|---|---|
| Rhode Island | 11 | 11.0 |
| Connecticut | 27 | 5.62 |
| Delaware | 10 | 5.26 |
| Massachusetts | 13 | 1.67 |
| Hawaii | 10 | 1.56 |
| New Jersey | 10 | 1.35 |
| Maryland | 11 | 1.13 |
| New Hampshire | 10 | 1.12 |
| Vermont | 10 | 1.09 |
| Ohio | 29 | 0.71 |
Rhode Island has eleven haunted places packed into roughly a thousand square miles, which works out at eleven per thousand, more than double Connecticut in second place. You could drive across the whole state in under an hour and pass most of them.
The most haunted state by raw count
| State | Documented haunted places |
|---|---|
| California | 32 |
| Ohio | 29 |
| Connecticut | 27 |
| Texas | 26 |
| Florida | 21 |
| Arizona | 21 |
| Kentucky | 21 |
| Alabama | 20 |
| Colorado | 20 |
| Indiana | 20 |
California leads on the raw number, which is roughly what you would expect from the most populous state in the country. Ohio in second is less obvious, and Connecticut in third is the genuine surprise.
Connecticut is the real answer
Connecticut is the only state that finishes in the top three on both measures that matter. Third in the country by raw count, second by density, and it is the forty-eighth largest state. Nowhere else manages to be both prolific and concentrated.
It has the ingredients. Four centuries of continuous European settlement, a colonial building stock that was never cleared, the country’s oldest witch trials predating Salem by decades, and a dense enough population to keep the stories in circulation without ever being dense enough to knock the buildings down.
What kind of places are actually haunted
| Type of place | Locations |
|---|---|
| Hotels | 112 |
| Houses | 104 |
| Inns | 88 |
| Woods | 77 |
| Mansions | 63 |
| Museums | 51 |
| Roads | 48 |
| Cemeteries | 48 |
| Forests | 43 |
| Hospitals | 39 |
| Theaters | 38 |
| Bars | 33 |
Hotels and houses lead, and the reason is less supernatural than structural. Hauntings need witnesses, and they need the same building to be occupied by different people over a long stretch of time. A hotel produces thousands of strangers sleeping in the same room across a century, each with no explanation for the noise at three in the morning and no way to compare notes. A private house passes between families who each arrive knowing nothing.
Roads and woods sit surprisingly high for places nobody lives. Those are almost always attached to a specific accident or disappearance, where the story is anchored to an event rather than a building.
How we counted, and what this does not measure
This is drawn from 705 locations we have researched and mapped, each with coordinates and cited sources. Population figures are from the 2020 census and land areas are US Census land-area figures excluding water.
The caveat matters, so we will put it plainly: this measures documented hauntings, not hauntings. It reflects where stories were written down, survived, and reached a source we could verify. States with strong local historical societies and long-running newspaper archives are always going to look more haunted than states without them, and that is a fact about record keeping rather than about ghosts.
We would also expect these numbers to move. We add locations continually, and every addition shifts the rankings slightly. This is a snapshot of what is currently documented, not a final verdict, and we will update it as the map fills in.
Anyone is welcome to cite these figures with a link back to this page. If you want the underlying per-state numbers for your own analysis, get in touch.
Reader sightings
Nobody has reported anything here yet. If you have been, you would be the first.
Leave a Reply